3QFY2019 Result Update | IT
February 2, 2019
HCL Technologies
REDUCE
CMP
`1034
Performance Highlights
Target Price
`900
(` cr) - Consl.
3QFY19
2QFY19
% chg (qoq)
3QFY18
% chg (yoy)
Net revenue
15,699
14,861
5.6
12,808
22.6
Investment Period
12 Months
EBIT
3,086
2,966
4.0
2,509
23.0
Stock Info
EBIT margin (%)
19.7
20.0
(30)bps
19.6
7bps
Sector
IT
PAT
2,611
2,540
2.8
2,194
19.0
Market Cap (` cr)
139,987
Net Debt (` cr)
(12140)'
Source: Company, Angel Research
Beta
0.4
52 Week High / Low
1125/880
HCL Tech on sales front posted 4.9% sequential growth in USD revenues to
Avg. D aily Volum e
87,836
US$2,202mn v/s. US$2,099mn in 2QFY2019. In Constant currency terms (CC), the
Face Value (`)
2
BSE Sensex
36,257
company posted a 5.6% qoq growth. EBIT margin came in at 19.7% v/s 20.0% in
Nifty
110,831
2QFY2019. Consequently, PAT came in at `2,611cr v/s. `2,540cr in 2QFY2019, a rise of
Reuters Code
HCLT.BO
Bloomberg Code
HCLT@IN
2.8% qoq. FY2019 revenue guidance is kept at the mid-range of 9.5-11.5% in CC,
while operating margin are expected to be in the range of
19.5-20.5%. We
Shareholding Pattern (%)
recommend a Reduce; given that the company is too dependent on the
Prom oters
60.1
MF / Banks / Indian Fls
8.2
acquisition as a strategy to grow higher than Industry. This will keep a check on
FII / NRIs / OCBs
28.3
its business ROIC & hence multiples.
Indian Public / Others
3.5
Quarterly highlights: HCL Tech on sales front posted 4.9% sequential growth in USD
Abs .(% )
3m
1 yr
3 yr
Sensex
7.0
0.8
46.1
revenues to US$2,202mn V/s. US$2,099mn in 2QFY2019. In Constant currency terms
HCL Tech
0.1
2.0
14.4
(CC), the company posted a 5.6% qoq growth. EBIT margin came in at 19.7% v/s
20.0% in 2QFY2019. Consequently, PAT came in at `2,611cr V/s. `2,540cr in 2QFY2019,
a rise of 2.8% qoq. Industry segment wise, the company’s Financial Services vertical
posted a 0.6% qoq de-growth in CC terms. The Manufacturing vertical (contributing
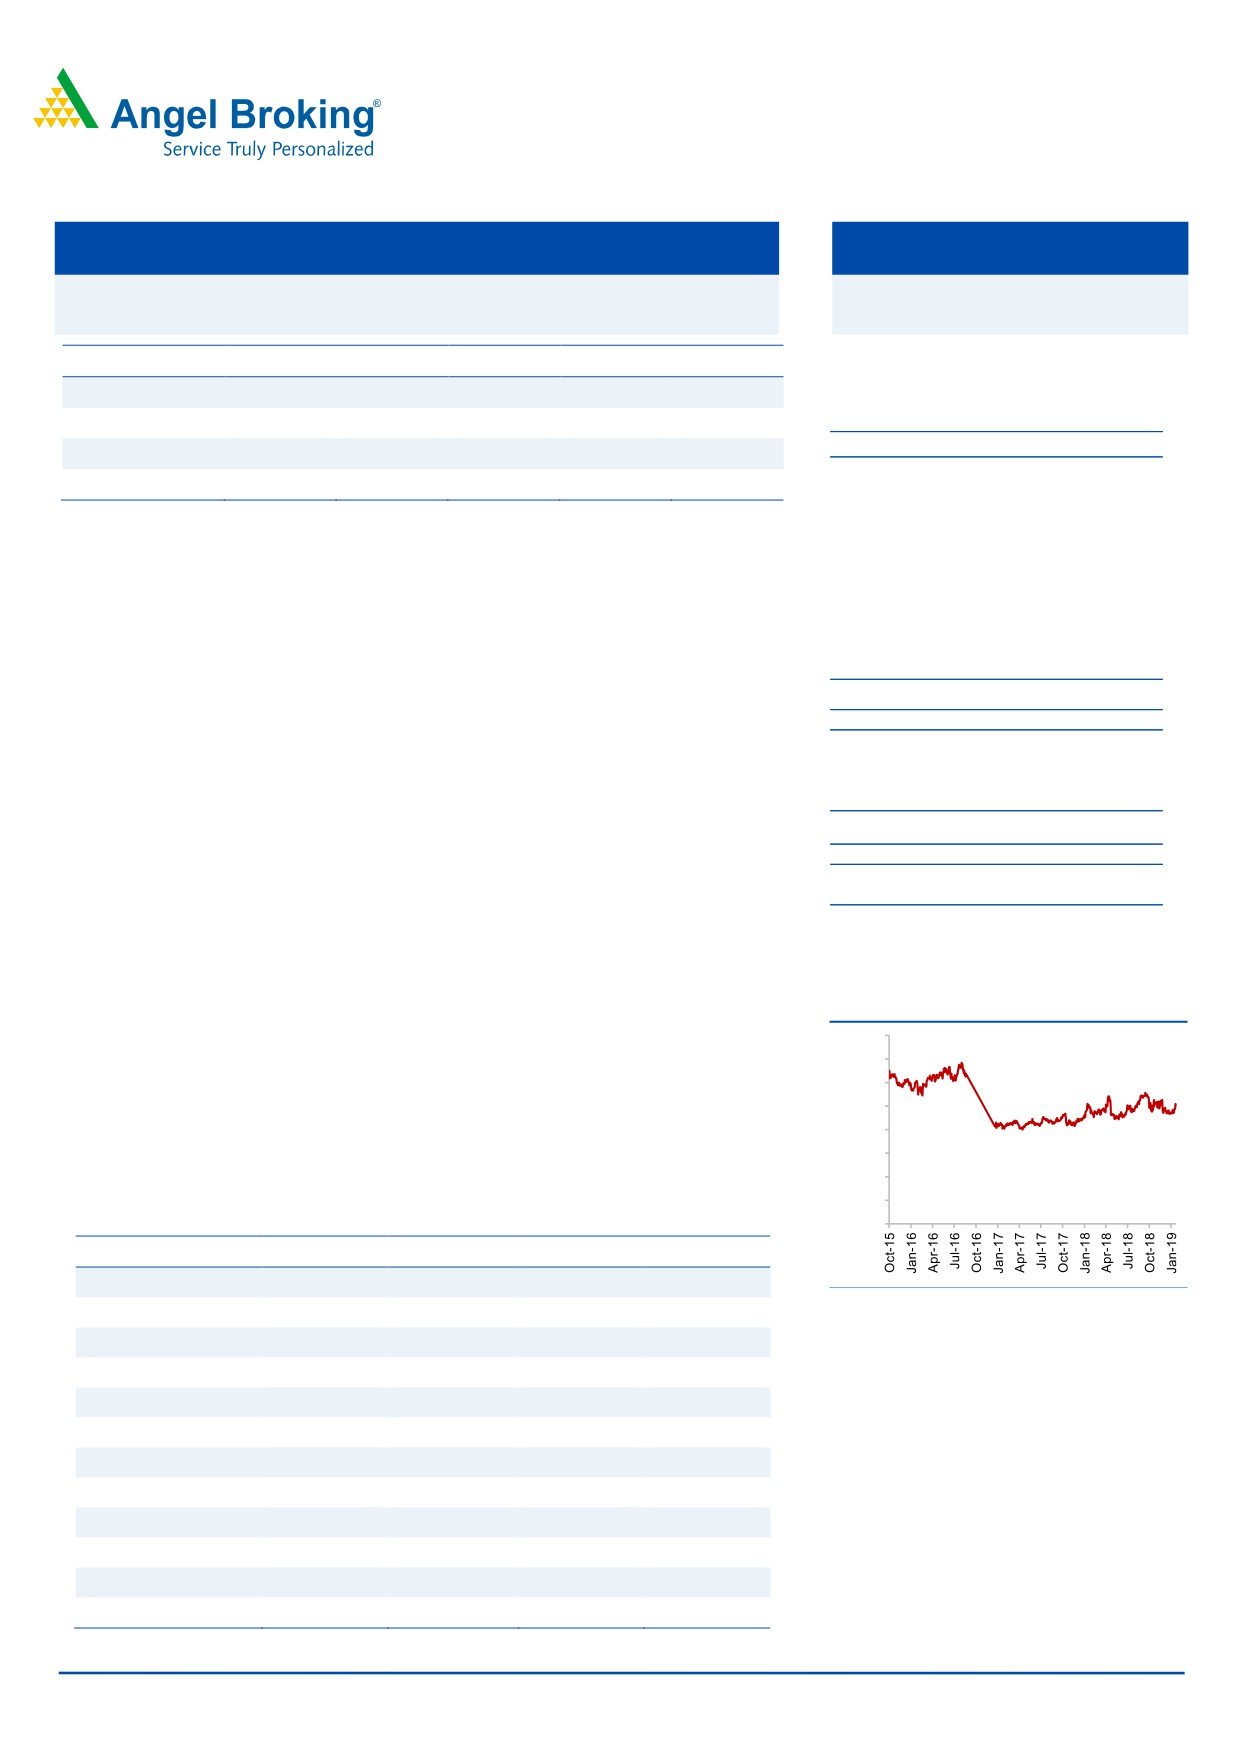
3-year price chart
17.7% to revenue) posted a 3.9% qoq growth in CC terms. Consequently, PAT came in
1,600
at `2,611cr V/s. `2,540cr in 2QFY2019, a rise of 2.8% qoq.
1,400
1,200
Outlook and valuation: We expect HCL Tech to post a USD and INR revenue CAGR
1,000
of 11.6% and 15.2% respectively over FY2018-21E. The growth will be aided by the
800
acquisitions. However, given its profitability & valuations & given the backdrop that it is
600
400
concentrated on few services; we recommend a Reduce stance.
200
Key financials (Consolidated, US GAAP)
0
Y/E March (` cr)
FY2018
FY2019E
FY2020E
FY2021E
Net sales
50,570
60,937
68,853
77,255
8.2
20.5
13.0
12.2
Source: Company, Angel Research
% chg
Net profit
8,781
10,150
11,229
12,575
% chg
3.8
15.6
10.6
12.0
EBITDA margin (%)
22.6
22.9
23.9
23.9
EPS (`)
62.3
72.0
79.6
89.2
P/E (x)
16.6
14.4
13.0
11.6
P/BV (x)
4.0
3.6
3.2
2.9
RoE (%)
23.9
24.7
24.6
24.7
20.6
22.0
21.3
21.7
Sarabjit kour Nangra
RoCE (%)
+91 22 3935 7800 Ext: 6806
EV/Sales (x)
2.6
2.1
1.9
1.6
EV/EBITDA (x)
11.4
9.0
8.0
6.7
Source: Company, Angel Research; Note: CMP as of February 1, 2019
Please refer to important disclosures at the end of this report
1
HCL Technologies | 3QFY2019 Result Update
Exhibit 1: 3QFY2019 performance (Consolidated, US GAAP)
Y/E March (` cr)
3QFY19
2QFY19
% chg (qoq)
3QFY18
% chg (yoy)
9MFY19
9MFY18
% chg(yoy)
Net revenue
15,699
14,861
5.6
12,808
22.6
44,437
37,391
18.8
Cost of revenue
10,152
9,589
5.9
8,412
20.7
22,781
19,329
17.9
Gross profit
5,547
5,272
5.2
4,396
26.2
21,656
18,062
19.9
SG&A expense
1,900
1,773
7.2
1,432
32.7
11,324
9,838
15.1
EBITDA
3,647
3,499
4.2
2,964
23.0
10,332
8,224
25.6
Dep. and amortization
561
533
5.3
455
23.3
1,528
954
60.2
EBIT
3,086
2,966
4.0
2,509
23.0
8,804
7,270
21.1
Other income
105
252
(58.3)
264
(60.2)
638
878
(27.3)
PBT
3,191
3,218
(0.8)
2,773
15.1
9,442
8,148
15.9
Income tax
566
678
(16.5)
579
(2.2)
1,872
1,656
13.0
PAT
2,625
2,540
3.3
2,194
19.6
7,570
6,492
16.6
Forex gain/(loss)
14
-
-
-
1
Adjusted PAT
2,611
2,540
2.8
2,194
19.0
7,570
6,493
16.6
EPS
19.3
18.2
5.7
15.8
22.2
55.8
46.6
19.7
Gross margin (%)
35.3
35.5
(14)bps
34.3
101bps
48.7
48.3
43bps
EBITDA margin (%)
23.2
23.5
(31)bps
23.1
9bps
23.3
22.0
126bps
EBIT margin (%)
19.7
20.0
(30)bps
19.6
7bps
19.8
19.4
37bps
PAT margin (%)
16.6
17.1
(46)bps
17.1
(50)bps
17.0
17.4
(33)bps
Source: Company, Angel Research
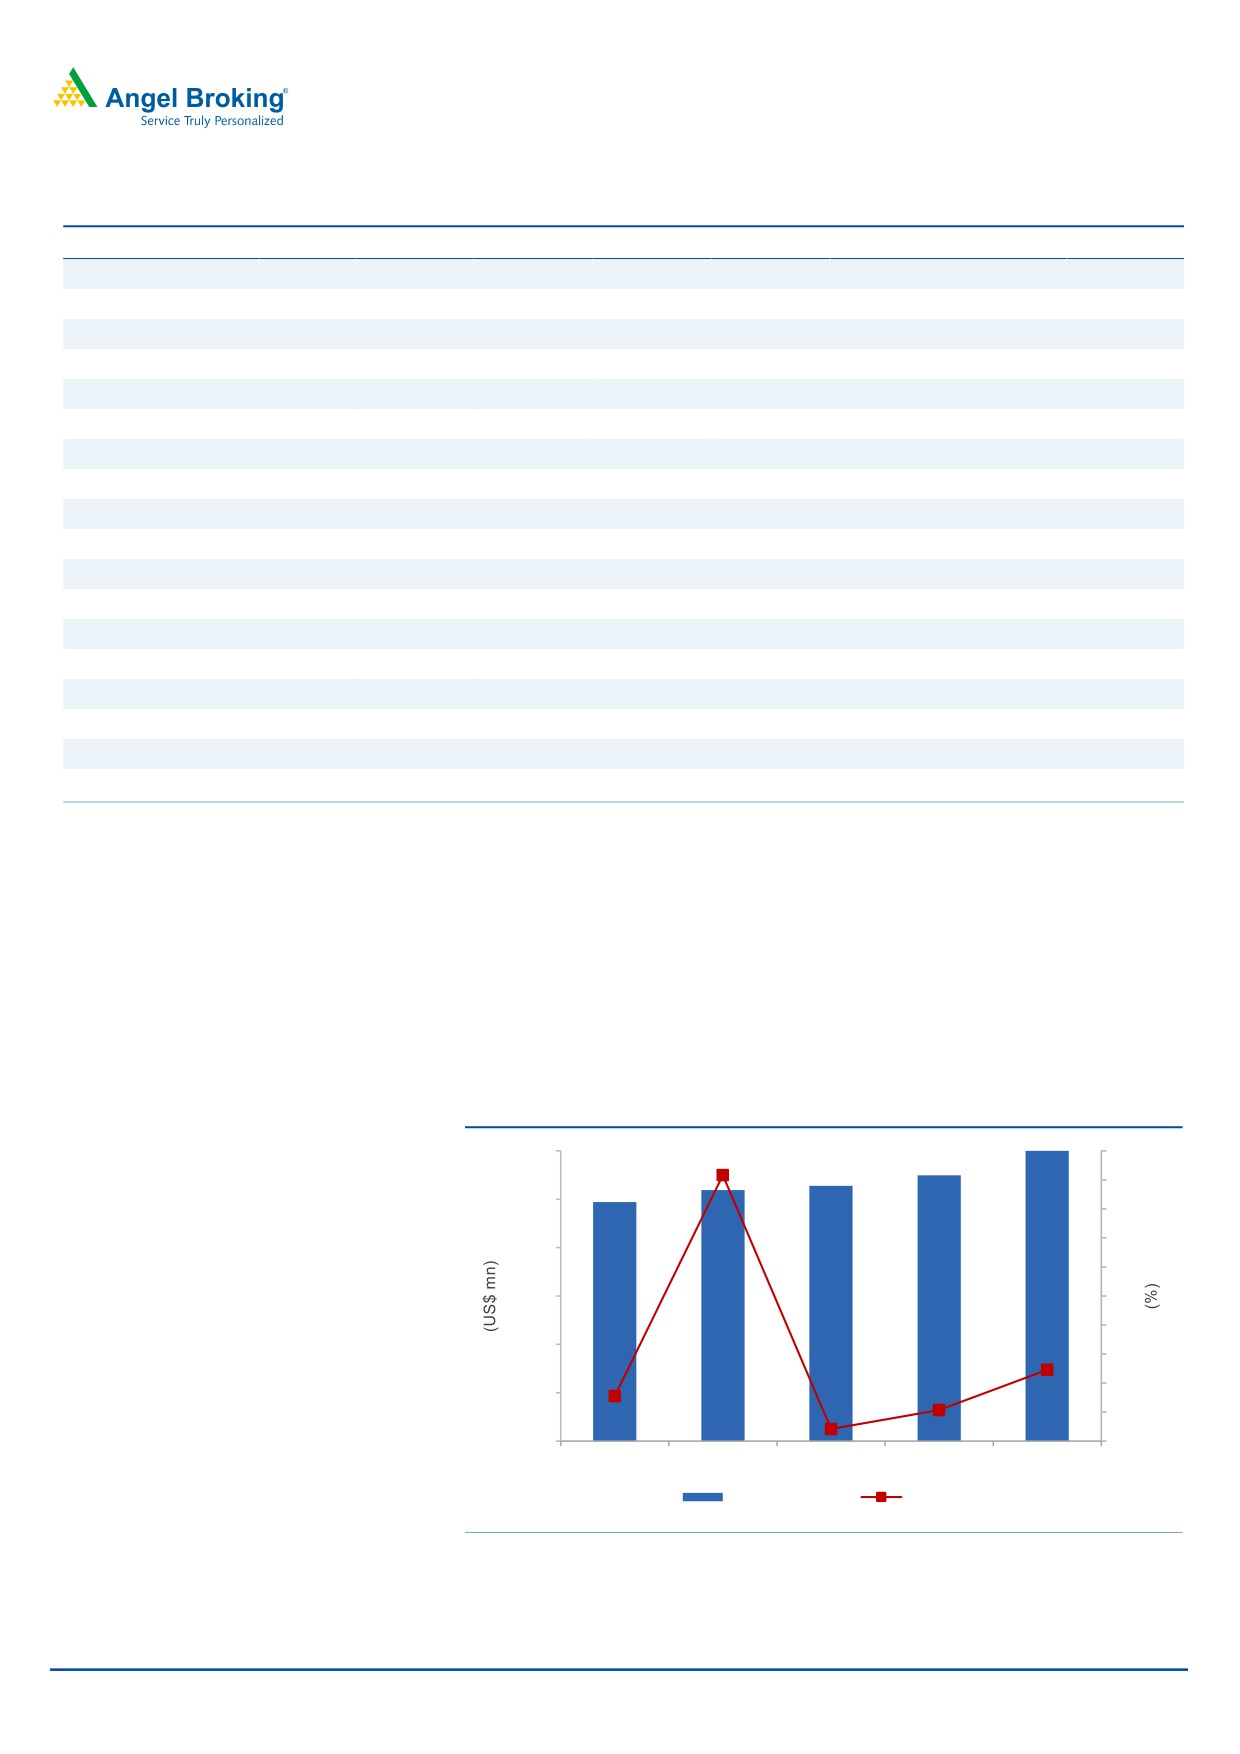
Robust Sales growth
HCL Tech on sales front posted 4.9% sequential growth in USD revenues to
US$2,202mn v/s. US$2,099mn in 2QFY2019. In Constant currency terms (CC), the
company posted a 5.6% qoq growth. Industry segment wise, the company’s Financial
Services vertical posted a 0.6% qoq de-growth in CC terms. The Manufacturing vertical
(contributing 17.7% to revenue) posted a 3.9% qoq growth in CC terms.
Exhibit 2: Revenue growth trend
2,200
20
18.3
18
2,000
16
14
1,800
12
1,600
10
8
1,400
6
4.9
4
1,200
3.1
2.1
2
1,988
2,038
2,055
2,099
2,202
0.8
1,000
0
3QFY18
4QFY18
1QFY19
2QFY19
3QFY19
Revenue (USD)
qoq growth (%)
Source: Company, Angel Research
February 2, 2019
2
HCL Technologies | 3QFY2019 Result Update
In terms of services, Engineering & R&D services (which constituted 25.5% of
sales) posted a growth of 5.1% qoq (CC), while Application services (accounting
for 32.0% of sales) grew by 2.3% qoq (CC). Infrastructure services, another
important segment of the company, which contributes around 37.5% to overall
sales, posted growth of 10.4% qoq (CC). Business services, which constituted 5.0%
of sales, de-grew by 5.1% qoq (CC).
Exhibit 3: Revenue growth trend (Service wise)
% of revenue
% growth CC (qoq) % growth (yoy)
Application services
32.0
2.3
2.5
Infrastructure services
37.5
10.4
16.5
Business services
5.0
(3.7)
50.1
Engineering and R&D services
25.5
5.1
17.4
Source: Company, Angel Research
Industry segment wise, the company’s Financial Services vertical (contributing
21.6% to revenue) posted a 0.6% qoq de-growth in CC terms. The Manufacturing
vertical (contributing 17.7% to revenue) posted a 3.9% qoq growth in CC terms.
Public services, Life Sciences & Healthcare, and Telecommunication, Media,
Publishing & Entertainment reported a qoq growth of (4.4) %, 5.8% and 35.4%
respectively, all in CC terms. Retail & CPG (contributing 10.2% of the revenue), on
the other hand, reported growth of 8.4% qoq in CC terms during the quarter.
Exhibit 4: Revenue growth trend (Industry wise)
% of revenue
% growth (CC qoq)
% growth (yoy)
Financial services
21.6
(0.6)
0.1
Manufacturing
17.7
3.9
1.5
Life sciences & Healthcare
13.0
5.8
23.4
Public Services
9.7
(4.4)
8.1
Retail & CPG
10.2
8.4
21.5
Telecom, MPE
9.2
35.4
40.3
Technology & Services
18.7
7.5
24.4
Source: Company, Angel Research
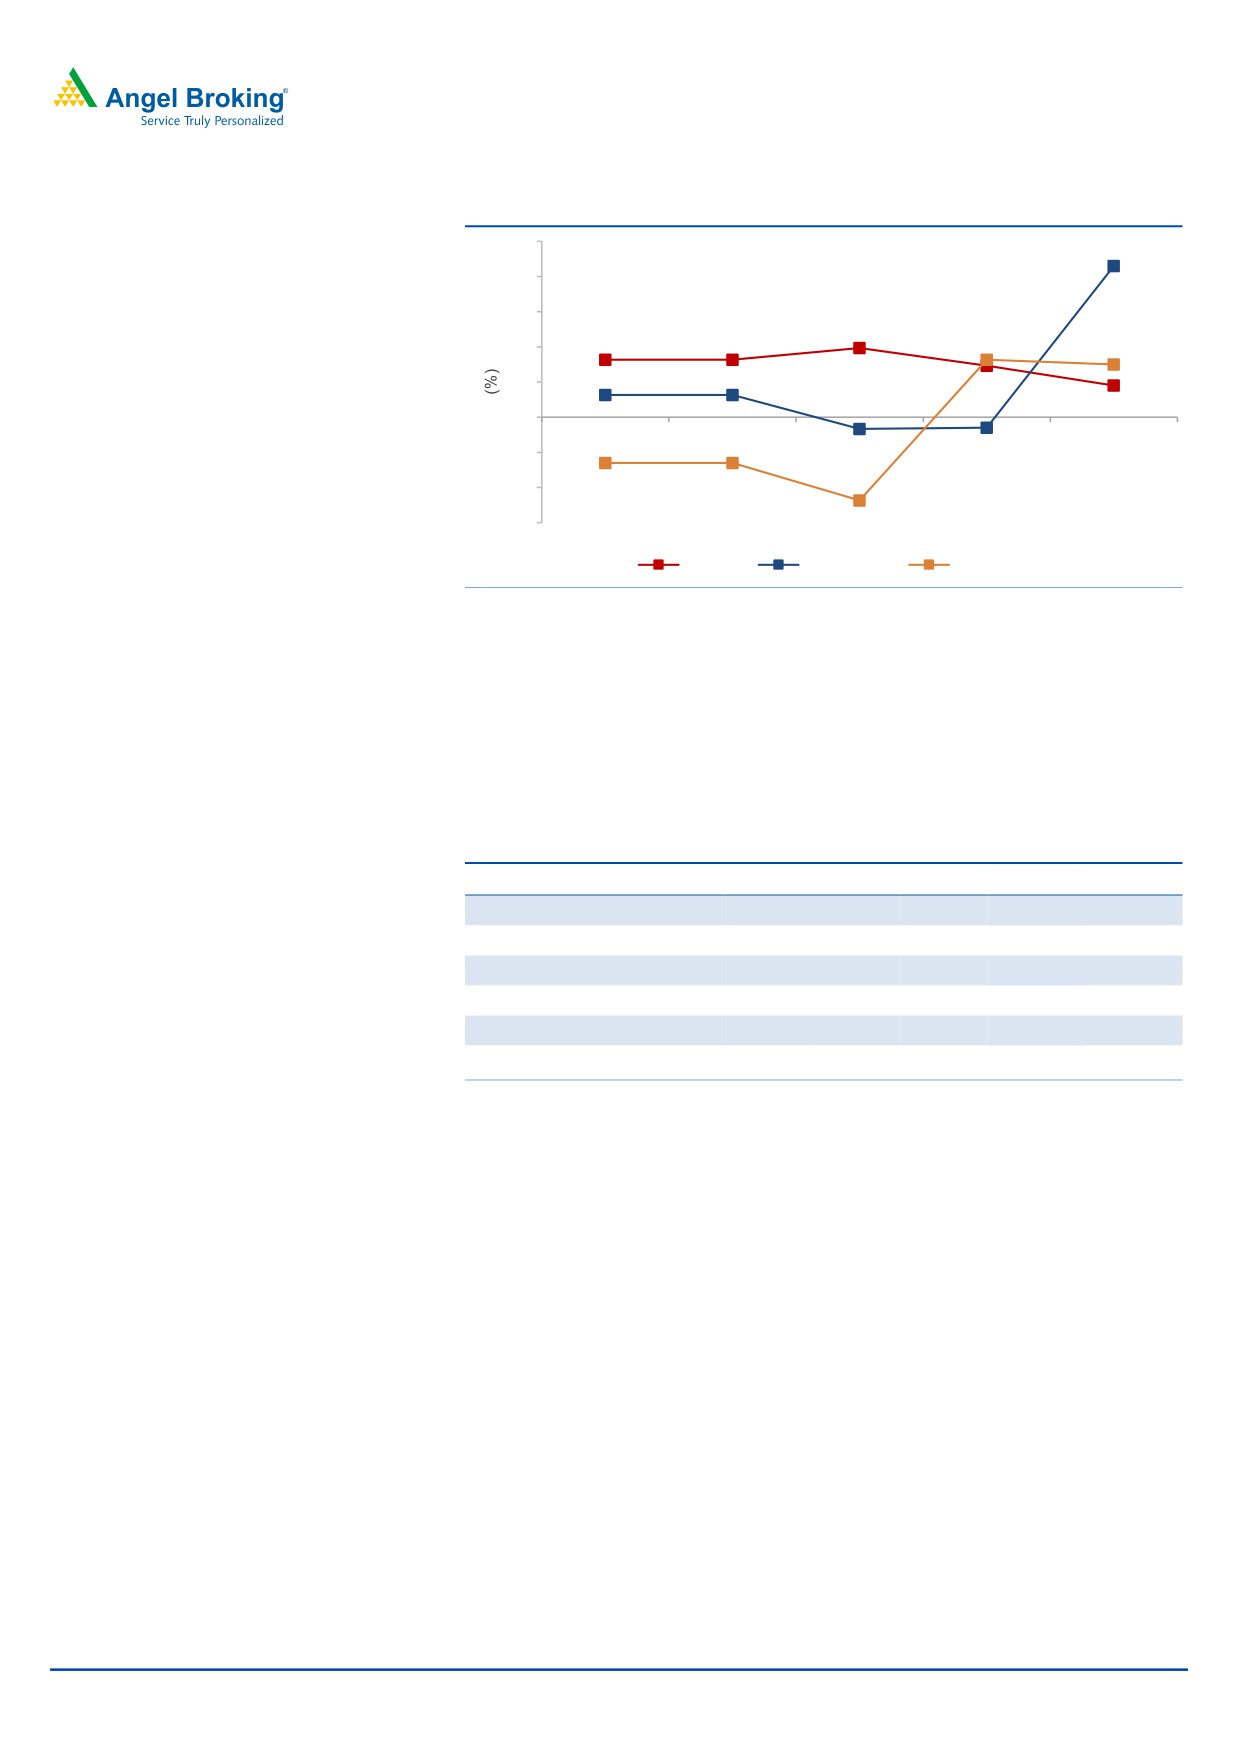
Among geographies, in CC terms, America grew by 2.7% qoq; RoW grew by 4.5%
qoq, while Europe grew by 12.9% qoq, during the period.
February 2, 2019
3
HCL Technologies | 3QFY2019 Result Update
Exhibit 5: Revenue growth trend (Geography wise in CC terms)
15
12.9
12
9
5.9
4.9
6
4.4
9
41.
1.9
3
2.7
(1.0)
0
4.5
(3)
(0.9)
(3.9)
(6)
(3.9)
(9)
(7.1)
3QFY18
4QFY18
1QFY19
2QFY19
3QFY19
US
Europe
Rest of the world
Source: Company, Angel Research
Hiring and utilization
During the quarter, the overall headcount of HCL Tech increased by 13,191 to
1,32,328 employees. The attrition rate in IT Services inched upwards to 17.8% (v/s.
17.1% in 2QFY2019) and the blended utilization level of the company remained
stagnant at 86.6% (86.7% in 2QFY2019).
Exhibit 6: Hiring trend
Particulars
3QFY18 4QFY18 1QFY19
2QFY19
3QFY19
Technical
1,08,831
1,09,565
1,13,404
1,16,910
1,21,273
Support
10,460
10,516
10,717
10,965
11,055
Total employee base
1,19,291
1,20,081
1,24,121
1,27,875
1,32,328
Gross addition
7,113
8,476
12,558
11,683
13,191
Net addition
251
790
4,040
3,754
4,453
Attrition - IT services (LTM) - %
15.2
15.5
16.3
17.1
17.8
Source: Company, Angel Research
February 2, 2019
4
HCL Technologies | 3QFY2019 Result Update
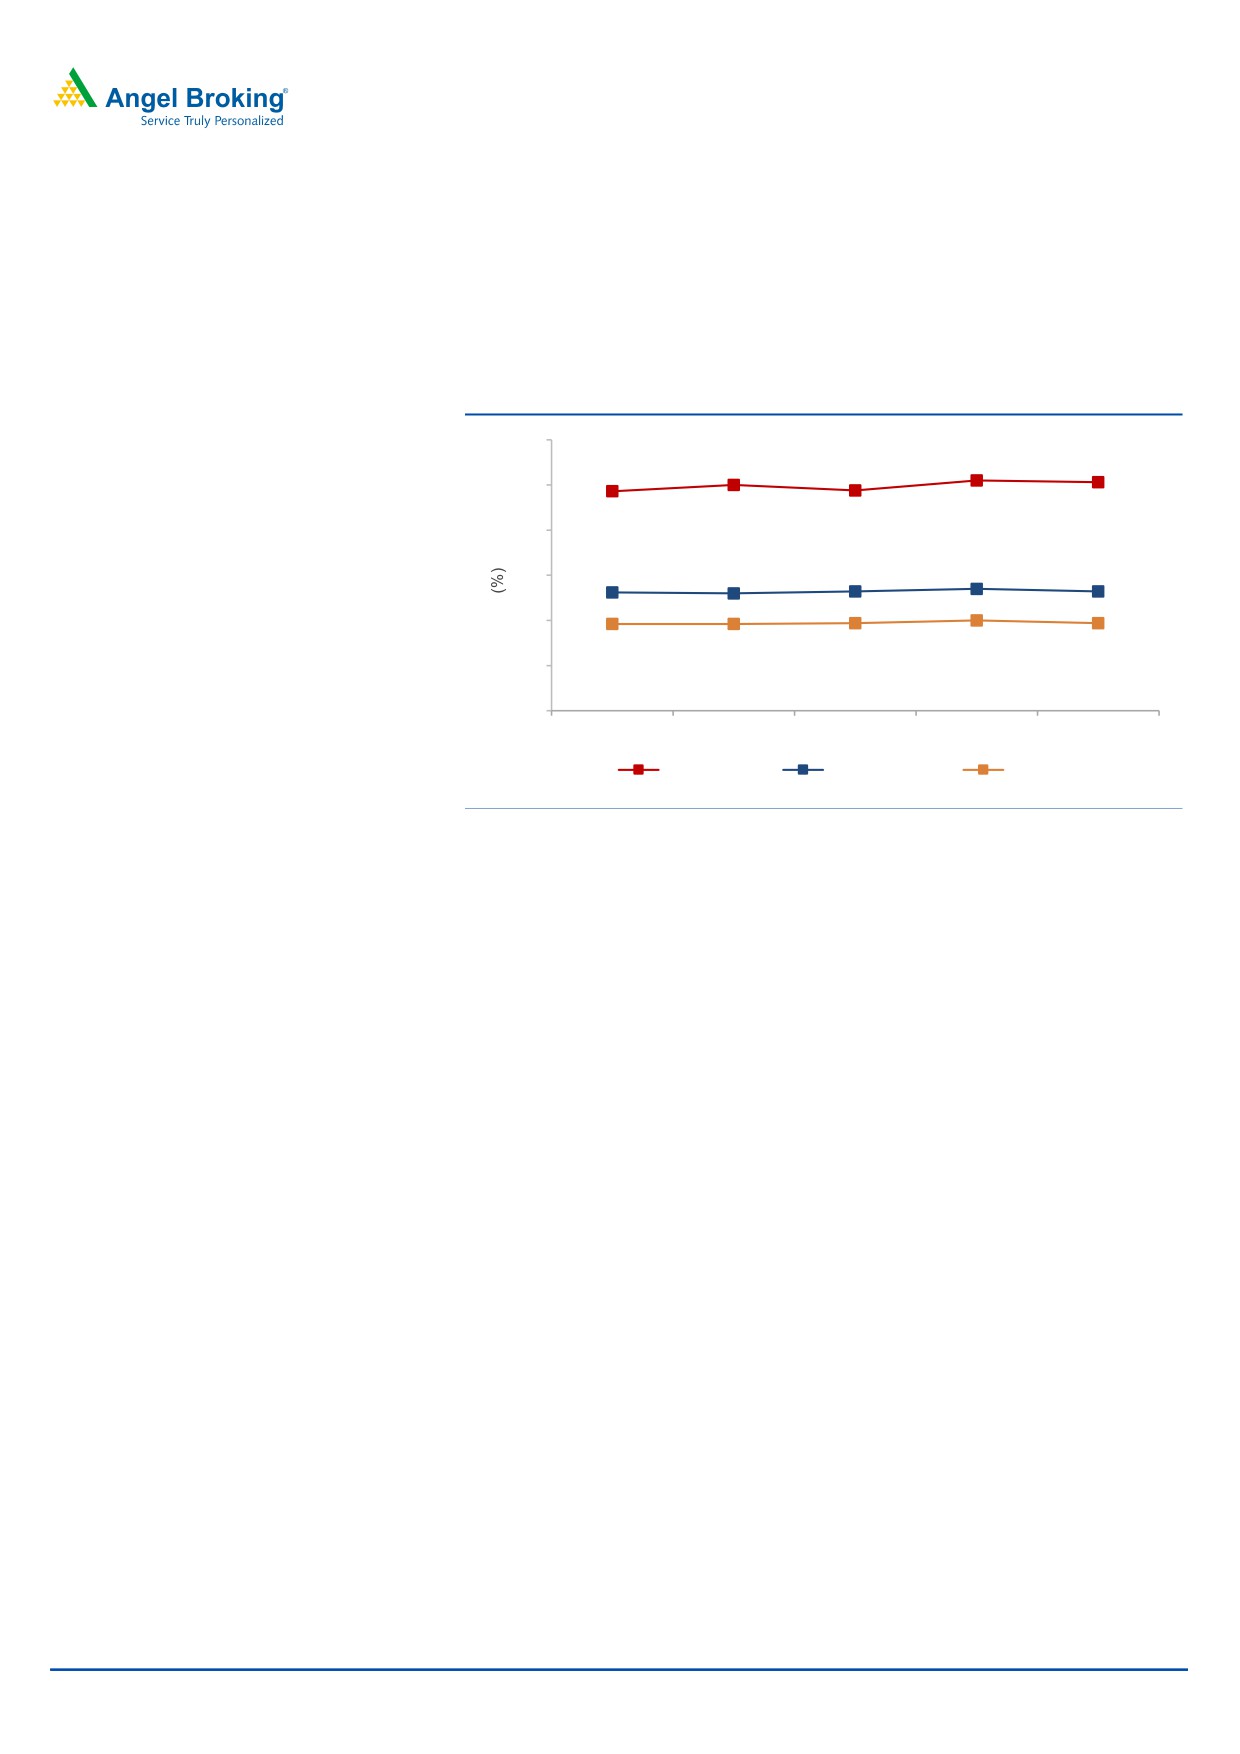
Operating margin shrink
On the operating front, the EBDITA margins came in at 23.2% (v/s. 23.5% in
2QFY2019), a qoq dip of 31bps, while the EBIT margins came in at 19.7%, a qoq
dip of 30bps. The negative impact of wage hikes was partly offset by higher
utilization and currency benefits.
Exhibit 7: Margin profile
40
35.0
35.5
35.3
34.3
34.4
35
30
23.1
23.0
23.2
23.5
23.2
25
20
19.6
19.7
20.0
19.6
19.7
15
10
3QFY18
4QFY18
1QFY19
2QFY19
3QFY19
Gross margin
EBITDA margin
EBIT margin
Source: Company, Angel Research
Client pyramid
The company signed
17 transformational deals this quarter. These deals
represented a well-balanced mix across service lines, industry verticals and
geographies. Company added US$5+ mn clients up by 15, US$10+ mn clients up by
8, US$50+ mn clients up by 4 and US$100+ mn clients up by 1.
February 2, 2019
5
HCL Technologies | 3QFY2019 Result Update
Investment arguments
Guidance re-iterated for FY2019: On the basis of deals on hand, the company
maintained to meet it’s revenue growth guidance of 9.5-11.5% in CC terms (
striving to achieve a mid-point of the guidance ) for FY2019, which includes a
component of inorganic growth, adjusting for which, the organic growth would
be in the range of 6.0-6.5% in CC for FY2019. The operating margin (EBIT) for
FY2019 is expected to be in the range of 19.5-20.5%. We expect HCL Tech to post
a USD and INR revenue CAGR of 11.6% and 15.2% respectively, over FY2018-21E.
IBM - Deal will mark its foray into enterprise product space: HCL Tech during
the quarter acquired 7 products from IBM for US$1.8bn. The products span across
areas such as Application Security, Endpoint Management, Low Code, Digital
Commerce and Experience, and Marketing Automation. The deal will close in 6
months and mostly funded through the internal accrual & debt of US$300mn.
Approximately 48% to be paid at close, most of balance to be paid after one year
of acquisition. The deal is likely to bring in incremental revenue of ~US$650mn on
a run-rate basis in second year after close. On operating front, EBITDA margins
are expected to be over 50% on a run-rate basis (slightly lower in year one of
acquisition), while Cash EPS accretion of ~15% is expected. With this, the product
contribution to the sales will increase from 11.9% in 9MFY2019 to 17%. The deal
seems though seems fairly valued on PE basis; but given high that the portfolio
will have a little growth; given mature nature of products, we find the deal
expensive on EV/ sales basis at around 2.7x.
Healthy pipeline: HCL Tech signed 17 transformational deals this quarter, across
service lines and industry verticals. The broad-based business wins were driven by
next-generation integrated offerings - Next-Gen ITO, BEYONDigital, and IoT
WoRKS, reflecting investments in Internet of Things, digital technologies, cloud,
automation and artificial intelligence. These deals represented a well-balanced
mix across service lines, industry verticals and geographies. Company added
US$5+ mn clients up by 15, US$10+ mn clients up by 8, US$50+ mn clients up by
4 and US$100+ mn clients up by 1.
Outlook & Valuation
We expect HCL Tech to post a USD and INR revenue CAGR of 11.6% and 15.2%
respectively over FY2018-21E. The growth will be aided by the acquisitions.
However, given its profitability & valuations & given the backdrop that it is
concentrated on few services; we recommend a Reduce stance.
Company Background
HCL Tech is India's fifth largest IT services company, with over 1,30,000 employees
catering to more than 600 clients. The company's service offerings include
Enterprise Application Services (EAS), Custom Applications, Engineering Research
& Development (ERD), and Infrastructure Management Services (IMS). In
December 2008, HCL Tech acquired UK-based SAP consulting company - Axon.
During 3QFY2016, the company acquired Geometric Software. In 3QFY2019, it
acquired seven products from IBM for US$1.8bn.
February 2, 2019
6
HCL Technologies | 3QFY2019 Result Update
Profit and loss statement (Consolidated, US GAAP)
Y/E Mar (` cr)
FY2017
FY2018
FY2019E
FY2020E
FY2021E
Net sales
46,723
50,570
60,937
68,853
77,255
Cost of revenues
30,890
33,237
39,852
43,928
49,288
Gross profit
15,833
17,333
21,084
24,925
27,966
% of net sales
33.9
34.3
34.6
36.2
36.2
SG&A expenses
5,524
5,894
7,130
8,469
9,502
% of net sales
11.8
11.7
11.7
12.3
12.3
EBITDA
10,309
11,439
13,954
16,456
18,464
% of net sales
22.1
22.6
22.9
23.9
23.9
Depreciation and amort.
835
1453
1767
2920
3245
% of net sales
1.8
2.9
2.9
4.2
4.2
EBIT
9,474
9,986
12,187
13,536
15,219
% of net sales
20.3
19.7
20.0
19.7
19.7
Other income, net
934
1,111
500
500
500
Profit before tax
10,408
11,097
12,687
14,036
15,719
Provision for tax
1,952
2,316
2,537
2,807
3,144
% of PBT
18.8
20.9
20.0
20.0
20.0
PAT
8,457
8,781
10,150
11,229
12,575
Fully diluted EPS (`)
60.0
62.3
72.0
79.6
89.2
February 2, 2019
7
HCL Technologies | 3QFY2019 Result Update
Balance sheet (Consolidated, US GAAP)
Y/E Mar (` cr)
FY2017 FY2018 FY2019E FY2020E FY2021E
Cash and cash equivalent
1,317
1,694
574
1,437
2,733
Account receivables, net
8,301
9,639
11,615
13,123
14,725
Unbilled receivables
2,501
2,618
3,169
3,580
4,017
Deposit with banks
10,220
5,727
10,806
11,056
11,036
Deposit (one year with HDFC ltd)
-
-
-
-
-
Invest. securities, available for sale
1,146
2,357
2,251
255
3,435
Other current assets
2,983
2,520
2,825
3,125
3,126
Total current assets
26,468
24,555
31,240
32,577
39,072
Property and equipment, net
4,681
5,185
5,485
5,785
6,085
Intangible assets, net
11,426
14,406
14,406
20,775
20,775
Deposits with HDFC Ltd.
-
-
-
-
Fixed deposits with banks
-
-
-
-
-
Investment securities HTM
147
27
27
27
48
Investment in equity investee
-
-
-
-
-
Other assets
3,712
4,263
4,263
4,263
4,263
Total assets
46,432
48,435
55,420
63,426
70,243
Current liabilities
11,148
9,914
11,876
13,091
14,688
Borrowings
542
437
437
2,567
2,567
Other liabilities
1,253
1,267
2,078
2,079
2,080
Total liabilities
12,942
11,618
14,391
17,737
19,335
Minority interest
-
-
-
-
-
Total stockholder equity
33,490
36,817
41,029
45,689
50,908
Total liab. and stock holder equity
46,432
48,435
55,420
63,426
70,243
February 2, 2019
8
HCL Technologies | 3QFY2019 Result Update
Cash flow statement (Consolidated, US GAAP)
Y/E Mar (` cr)
FY2017
FY2018
FY2019E FY2020E FY2021E
Pre tax profit from operations
8,457
8,781
10,150
11,229
12,575
Depreciation
835
1,453
1,767
2,920
3,245
Expenses (deffered)/written off/others
(48)
(48)
(48)
(48)
(48)
Pre tax cash from operations
9,244
10,186
11,869
14,101
15,772
Other income/prior period ad
934
1,111
500
500
500
Net cash from operations
10,178
11,297
12,369
14,601
16,272
Tax
(1,952)
(2,316)
(2,537)
(2,807)
(3,144)
Cash profits
8,226
8,981
9,832
11,793
13,128
(Inc)/dec in current assets
(653)
(992)
(2,831)
(2,220)
(2,039)
Inc/(dec) in current liabilties
1,639
(1,233)
1,962
1,215
1,597
Net trade working capital
987
(2,225)
(869)
(1,006)
(442)
Cashflow from operating activities
9,213
6,756
8,963
10,787
12,686
(Inc)/dec in fixed assets
(358)
(504)
(300)
(300)
(300)
(Inc)/dec in intangibles
(5,006)
(2,980)
-
(6,369)
-
(Inc)/dec in investments
(242)
3,282
(4,974)
1,746
(3,160)
(Inc)/dec in minority interest
-
-
-
-
-
Inc/(dec) in non current liabilities
(11)
-
-
-
-
(Inc)/dec in non current assets
(573)
463
(305)
(300)
(1)
Cashflow from investing activities
(6,189)
260
(5,579)
(5,223)
(3,461)
Inc/(dec) in debt
-
-
-
-
-
Inc/(dec) in equity/premium
-
-
-
-
-
ESOP charges
(103)
(103)
(103)
(103)
(103)
Dividends
(3,960)
(1,980)
(5,938)
(6,569)
(7,357)
Others
1,769
(3,617)
4,350
1,681
(329)
Cashflow from financing activities
(2,294)
(5,700)
(1,690)
(4,991)
(7,788)
Cash generated/(utilised)
587
377
(1,120)
863
1,296
Cash at start of the year
729
1,317
1,694
574
1,437
Cash at end of the year
1,317
1,694
574
1,437
2,733
February 2, 2019
9
HCL Technologies | 3QFY2019 Result Update
Key ratios
Y/E Mar
FY2017 FY2018 FY2019E FY2020E FY2021E
Valuation ratio (x)
P/E (on FDEPS)
17.2
16.6
14.4
13.0
11.6
P/CEPS
15.7
14.3
12.2
10.3
9.2
P/BVPS
4.4
4.0
3.6
3.2
2.9
Dividend yield (%)
2.3
1.2
3.5
3.8
4.3
EV/Sales
2.7
2.6
2.1
1.9
1.6
EV/EBITDA
12.4
11.4
9.0
8.0
6.7
EV/Total assets
2.8
2.7
2.3
2.1
1.8
Per share data (`)
EPS (Fully diluted)
60.0
62.3
72.0
79.6
89.2
Cash EPS
65.9
72.6
84.5
100.3
112.2
Dividend
24.0
12.0
36.0
39.8
44.6
Book value
237
261
291
324
361
Dupont analysis
Tax retention ratio (PAT/PBT)
0.8
0.8
0.8
0.8
0.8
Cost of debt (PBT/EBIT)
1.1
1.1
1.0
1.0
1.0
EBIT margin (EBIT/Sales)
0.2
0.2
0.2
0.2
0.2
Asset turnover ratio (Sales/Assets)
1.0
1.0
1.1
1.1
1.1
Leverage ratio (Assets/Equity)
1.4
1.3
1.4
1.4
1.4
Operating ROE
25.3
23.9
24.7
24.6
24.7
Return ratios (%)
RoCE (pre-tax)
20.4
20.6
22.0
21.3
21.7
Angel RoIC
28.2
25.8
29.2
26.7
28.7
RoE
25.3
23.9
24.7
24.6
24.7
Turnover ratios (x)
Asset turnover (fixed assets)
10.4
10.3
11.4
12.2
13.0
Receivables days
78
72
76
74
74
February 2, 2019
10
HCL Technologies | 3QFY2019 Result Update
Research Team Tel: 022 - 39357800
DISCLAIMER
Angel Broking Limited (hereinafter referred to as “Angel”) is a registered Member of National Stock Exchange of India Limited,
Bombay Stock Exchange Limited, Metropolitan Stock Exchange Limited, Multi Commodity Exchange of India Ltd and National
Commodity & Derivatives Exchange Ltd It is also registered as a Depository Participant with CDSL and Portfolio Manager and
Investment Adviser with SEBI. It also has registration with AMFI as a Mutual Fund Distributor. Angel Broking Limited is a registered
entity with SEBI for Research Analyst in terms of SEBI (Research Analyst) Regulations, 2014 vide registration number INH000000164.
Angel or its associates has not been debarred/ suspended by SEBI or any other regulatory authority for accessing /dealing in
securities Market. Angel or its associates/analyst has not received any compensation / managed or co-managed public offering of
securities of the company covered by Analyst during the past twelve months.
This document is solely for the personal information of the recipient, and must not be singularly used as the basis of any investment
decision. Nothing in this document should be construed as investment or financial advice. Each recipient of this document should
make such investigations as they deem necessary to arrive at an independent evaluation of an investment in the securities of the
companies referred to in this document (including the merits and risks involved), and should consult their own advisors to determine
the merits and risks of such an investment.
Reports based on technical and derivative analysis center on studying charts of a stock's price movement, outstanding positions and
trading volume, as opposed to focusing on a company's fundamentals and, as such, may not match with a report on a company's
fundamentals. Investors are advised to refer the Fundamental and Technical Research Reports available on our website to evaluate
the contrary view, if any
The information in this document has been printed on the basis of publicly available information, internal data and other reliable
sources believed to be true, but we do not represent that it is accurate or complete and it should not be relied on as such, as this
document is for general guidance only. Angel Broking Limited or any of its affiliates/ group companies shall not be in any way
responsible for any loss or damage that may arise to any person from any inadvertent error in the information contained in this
report. Angel Broking Limited has not independently verified all the information contained within this document. Accordingly, we
cannot testify, nor make any representation or warranty, express or implied, to the accuracy, contents or data contained within this
document. While Angel Broking Limited endeavors to update on a reasonable basis the information discussed in this material, there
may be regulatory, compliance, or other reasons that prevent us from doing so.
This document is being supplied to you solely for your information, and its contents, information or data may not be reproduced,
redistributed or passed on, directly or indirectly.
Neither Angel Broking Limited, nor its directors, employees or affiliates shall be liable for any loss or damage that may arise from or
in connection with the use of this information.
Disclosure of Interest Statement
HCL Tech
1. Financial interest of research analyst or Angel or his Associate or his relative
No
2. Ownership of 1% or more of the stock by research analyst or Angel or associates or
No
relatives
3. Served as an officer, director or employee of the company covered under Research
No
4. Broking relationship with company covered under Research
No
Ratings (Based on expected returns
Buy (> 15%)
Accumulate (5% to 15%)
Neutral (-5 to 5%)
over 12 months investment period):
Reduce (-5% to -15%)
Sell (< -15)
February 2, 2019
11